
Understanding AWS Cost Explorer: Simplify Your Cloud Spending Management!

What is AWS Cost Explorer?
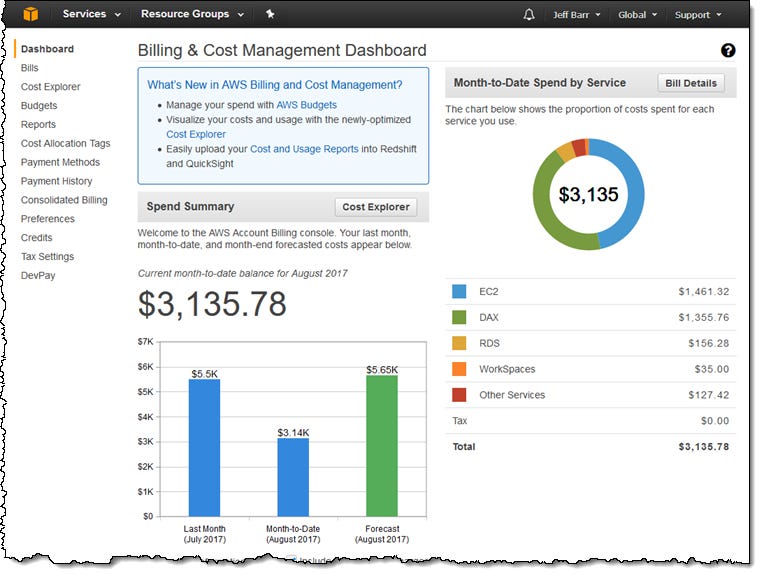
AWS Cost Explorer is a tool that enables you to view and analyze your costs and usage. You can explore your usage and costs using the main graph, the Cost Explorer cost and usage reports, or the Cost Explorer RI reports.
Why should you use AWS Cost Explorer?
AWS Cost Explorer features a user-friendly interface that enables you to visualize, understand, and manage your AWS costs and usage over time. You can analyze your data at a high level or delve deeper into your cost and usage patterns to identify trends, pinpoint cost drivers, and detect anomalies.
Benefits of using AWS Cost Explorer

Preconfigured Views: Access cost and usage information, along with business insights, through preconfigured views.
Filtering and Grouping: Dive deep into your cost and usage data by utilizing filtering and grouping options.
Cost and Usage Forecast: Generate a forecast for costs and usage over a future time range for your reports.
Create Custom Reports: Develop, save, and share custom reports to analyze various sets of data.
Use cases of AWS Cost Explorer

Access AWS Cost Explorer’s API to programmatically query your cost and usage data.
Visualize AWS costs with daily or monthly granularity, and enable hourly and resource-level details for deeper insights.
Forecast future bills and set alarms and budgets.
Analyze trends with day-over-day, month-over-month, or year-over-year comparisons using graphs and tables.
Use Amazon Q Developer to ask questions like, “Which region had the highest cost increase last month?” for clear insights.
Features of AWS Cost Explorer
Cost and Usage Visualization
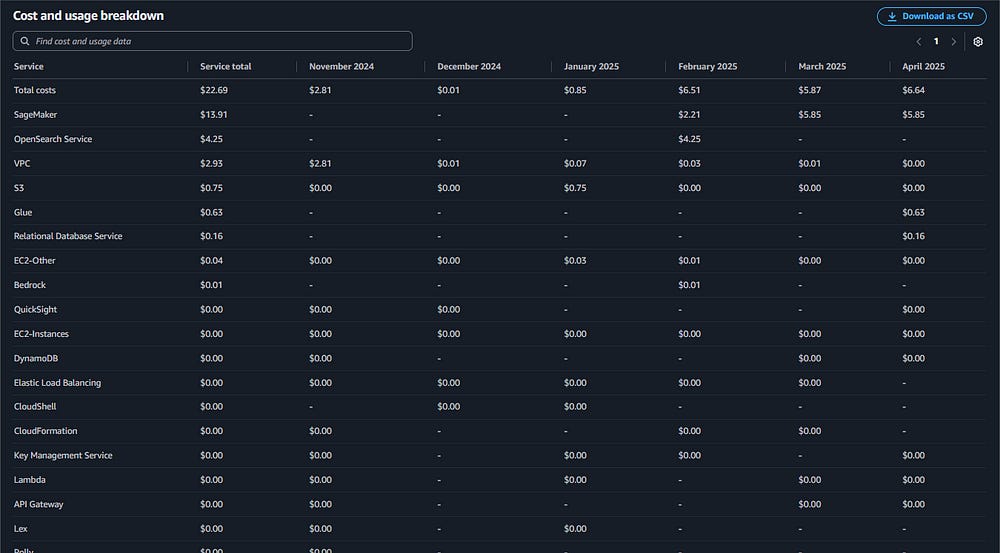
AWS Cost Explorer provides visual representations of your AWS costs and usage through graphs and tables, enabling quick insights and informed decision-making.
Filter and Group
You can filter and group your data by various dimensions, such as daily or monthly costs by member accounts or services. This helps identify spending patterns and understand how costs have changed over time.
Cost and Usage Forecasting
Cost Explorer can predict future costs and usage based on historical patterns, assisting with budgeting and planning for upcoming expenses.
Saved Reports
The tool offers preconfigured reports to monitor monthly costs by service, linked accounts, EC2 running hours, daily costs, and AWS Marketplace costs. You can also save custom reports for easy access.
Multi-Year History
Analyze up to 38 months of historical data at a monthly level to identify spending patterns and year-over-year changes.
Resource-Level Granularity
Monitor AWS costs and usage at the resource level, with daily data for all services and hourly data for EC2 resources over the last 14 days.
API Access
Programmatic access to all features is available through an API, allowing for automation of cost management tasks.
Exploring AWS Cost Explorer
Step 1: Accessing AWS Cost Explorer in AWS Management Console
Log in to your AWS Management Console
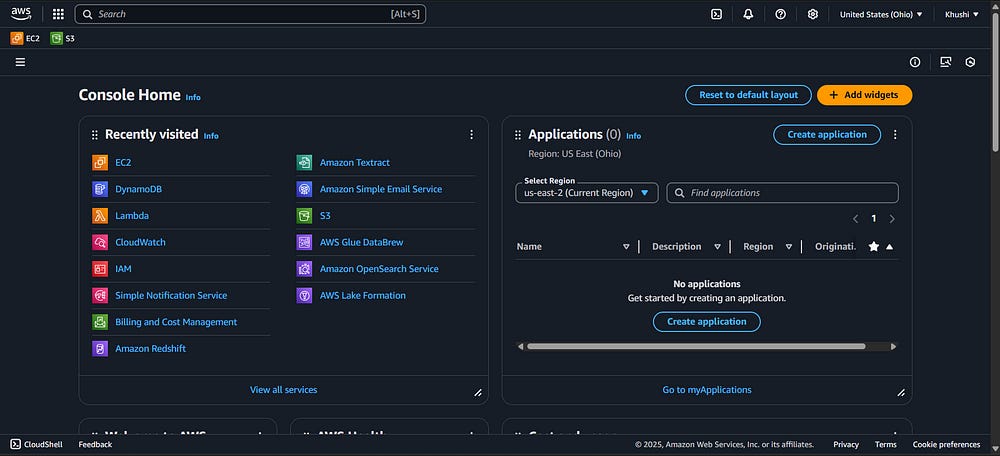
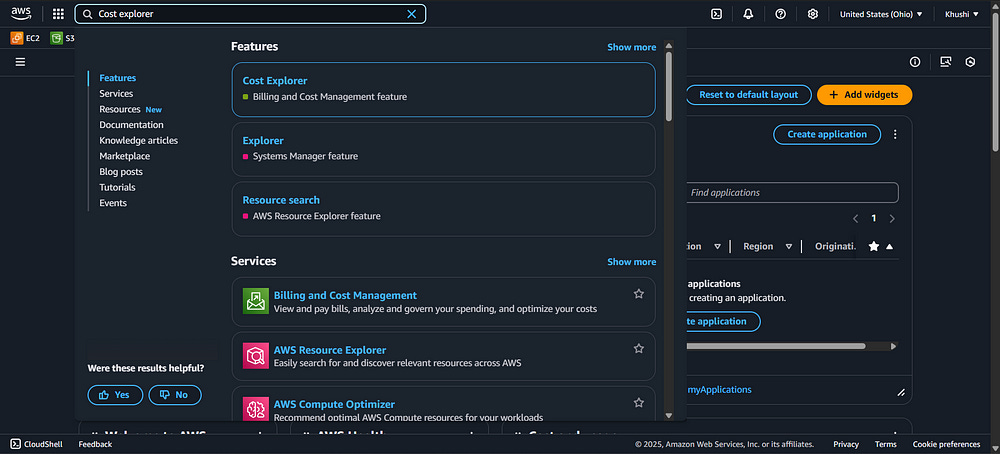
Step 2: Navigate to Cost Explorer
In Search bar, type “Cost Explorer”
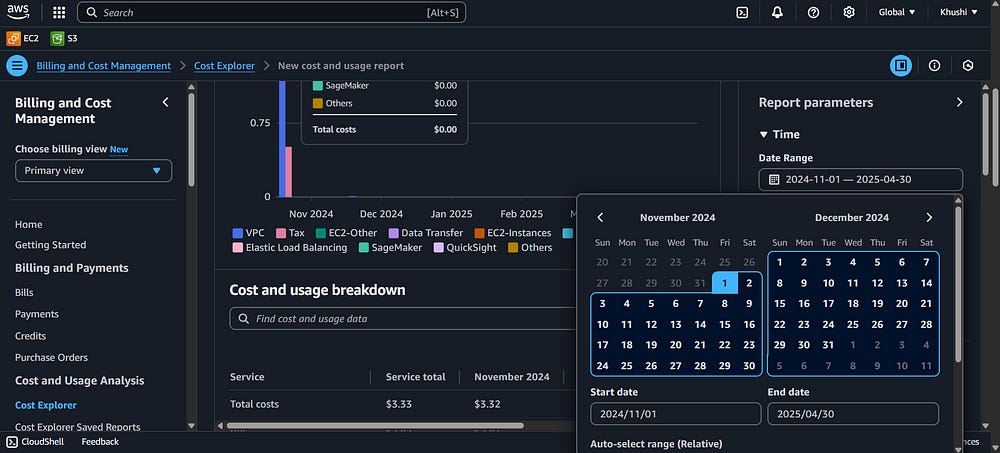
Step 3: Choose your Time Range
At the top, choose a time period (eg: Last 7 days, Month to date, Last 3 months). You can also customize the date range.
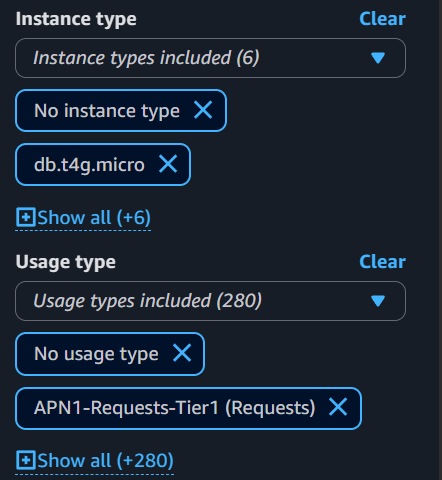
Step 3: Set Filters
You can filter the cost data by:
Service (EC2, S3, Lambda, etc.)
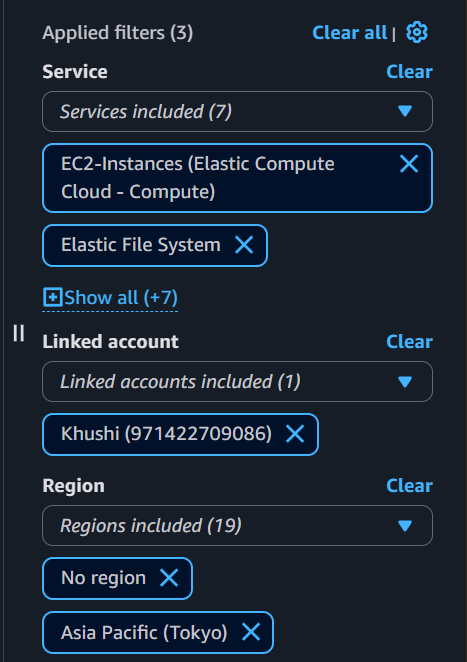
Usage Type, Region, Tags, etc.
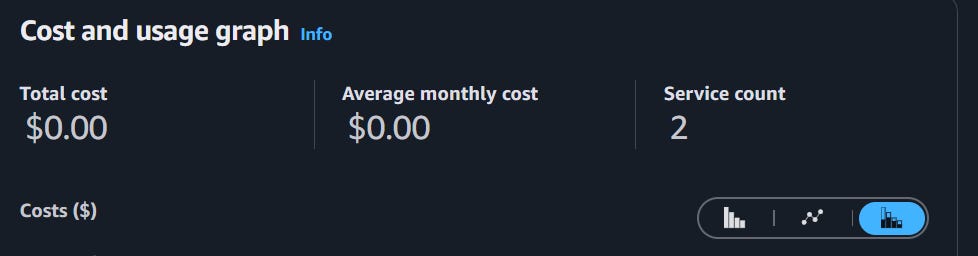
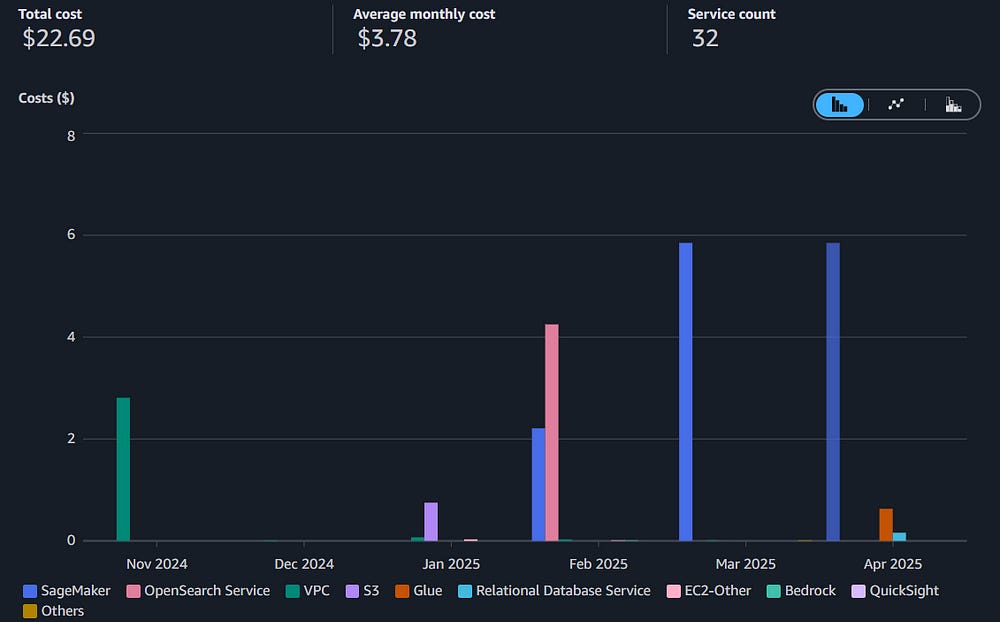
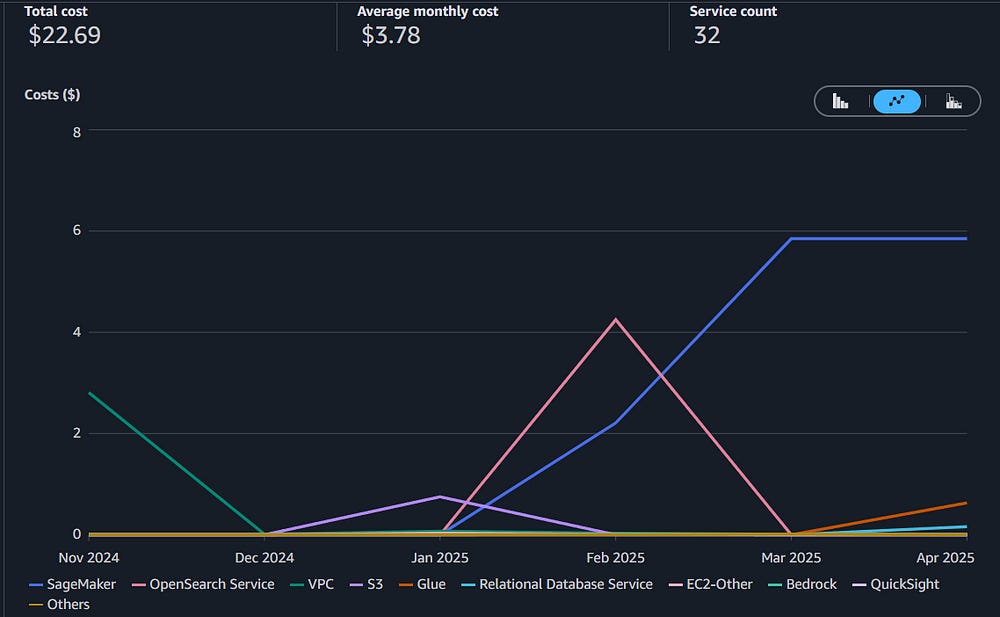
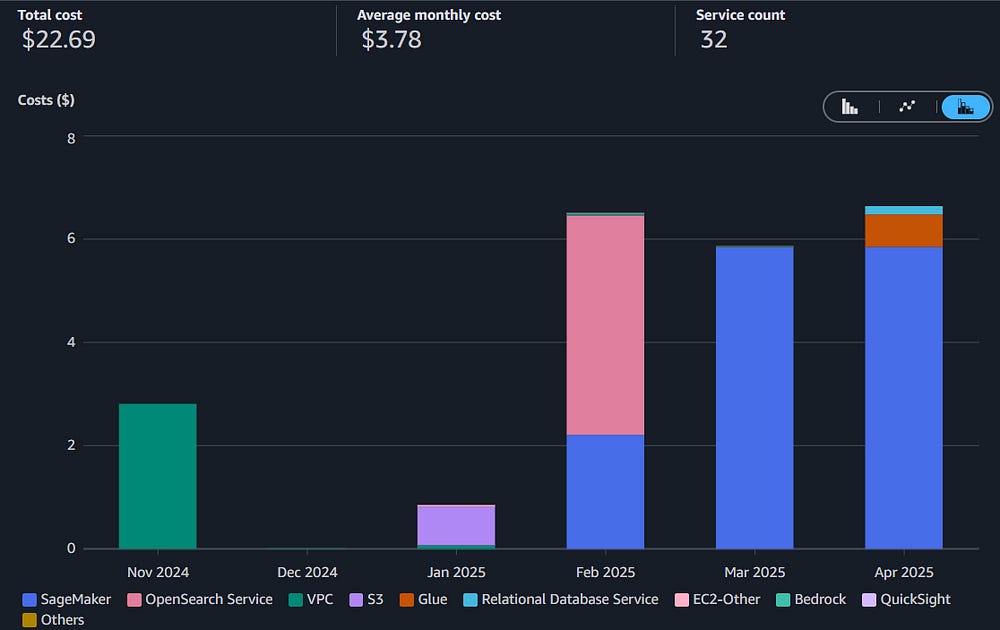
Step 3: Select a Chart Type
Bar, line, or pie charts to make the data digestible.

Step 4: Save or Download Reports
You can Save your current view as a report for future use.
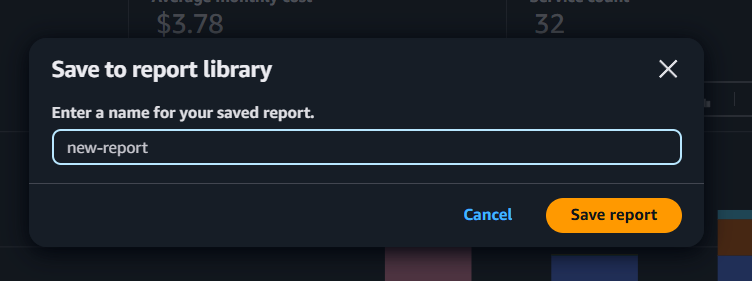
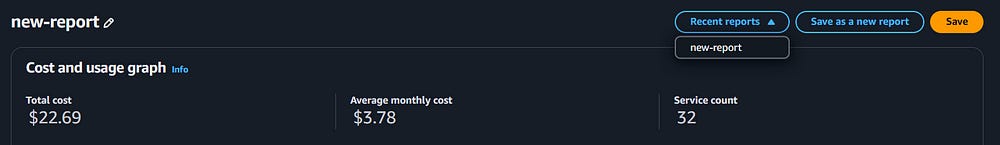
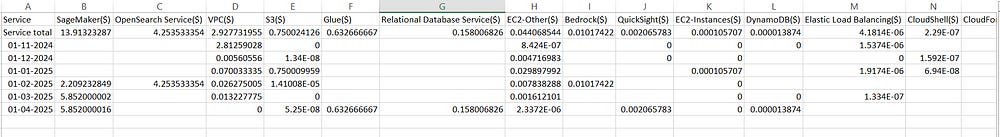
You can also download CSVs for offline analysis.
With AWS Cost Explorer, every dollar spent tells a story. Track it, understand it, and make it count.
Community Builders, AWS AI Horizons